Hi. I'm Kevin Hamm, a web producer/digital strategist/data journalist/interactive designer at The Denver Post. I've had the opportunity to work on a lot of interesting projects during my time at the Post, and I thought I'd drop some of them here. If you have any questions or comments, feel free to email me at hamm.kevin@gmail.com. Thanks for stopping by. The non-denverpost.com links are usually the full-width graphics that get iframed onto The Denver Post, so they can be, well, wide (but they're all responsive).
2024 general election results
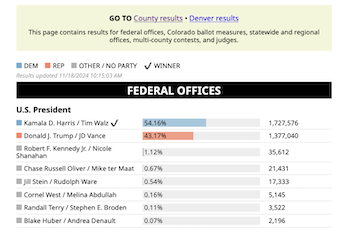
I built this live election results app using Python, HTML, CSS and Javascript. The source of the data are the dynamically generated state- and county-level results JSON files from the Colorado Secretary of State. Link on denverpost.com
Wildfires in Colorado and the United States
The wildfire tracker fetches wildfire data from the National Interagency Fire Center every hour and updates the map, list and chart. The map shows all fires currently burning in the United States and can be filtered in a variety of ways. The list shows wildfires larger than 10 acres that have burned in Colorado in 2023. The chart shows wildfires larger than 1,000 acres that have burned in Colorado in 2023. Link on denverpost.com
Congressional vote tracker
The Colorado congressional vote tracker scrapes voting data from the Clerk of the U.S. House of Representatives website using a Python script and renders it in a filterable and searchable DataTables table. Link on denverpost.com
Asthma in Denver: Search rates by neighborhood
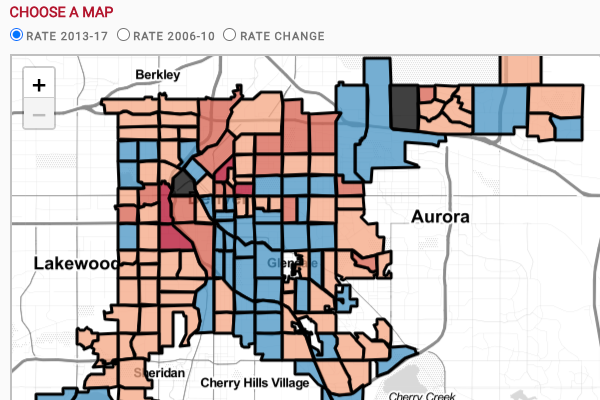
Asthma rates in the Elyria-Swansea and Globeville neighborhoods are already higher than the state average, and there is concern the Colorado Department of Transportation’s project to overhaul Interstate 70 could worsen the air quality in those and surrounding neighborhoods. The map, table and chart allow readers to drill down into asthma data to see rates where they live. Link on denverpost.com
2024 Colorado voter guide
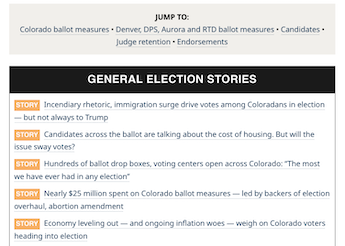
The voter guide collects Denver Post election stories, explainers, candidate Q&As and endorsements in an easy-to-use format. The Q&As cover dozens of races and more than 100 candidates. Link on denverpost.com
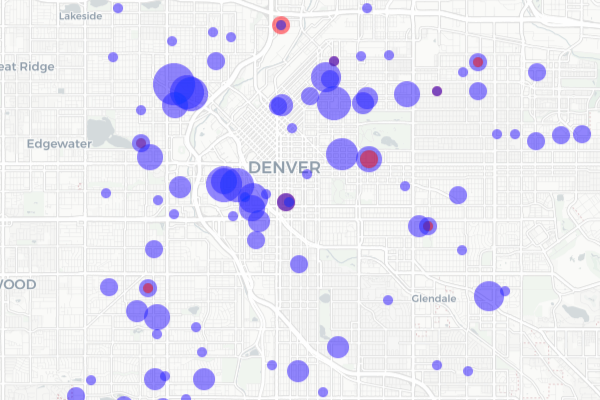
Denver Homicide Report
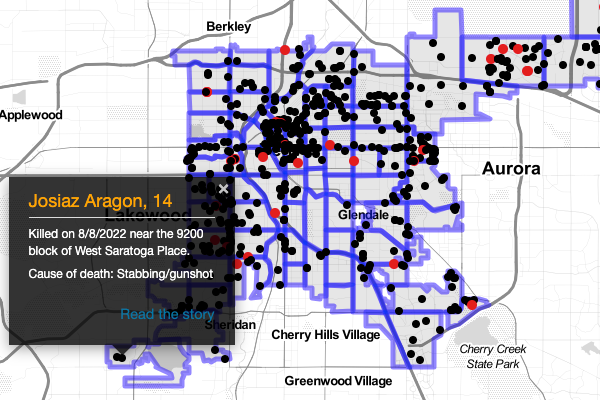
The Denver Homicide Report tracks every homicide in Denver from 2015 to the present in charts, a map and a searchable table. It pulls data dynamically from a Google Sheet. Link on denverpost.com
Where is Denver residential development happening?
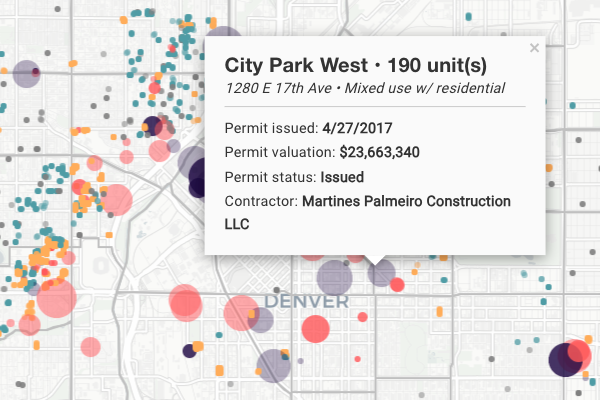
The Denver Post used city data to map apartments, houses, duplexes and townhomes built or authorized from Jan. 1, 2016 through Jan. 29, 2019. The results show intense apartment construction in downtown and along Interstate 25, a wave of lower-scale multifamily through northwest Denver, and more. Link on denverpost.com
How Colorado has voted in presidential elections (and how its politics have changed) since 1980
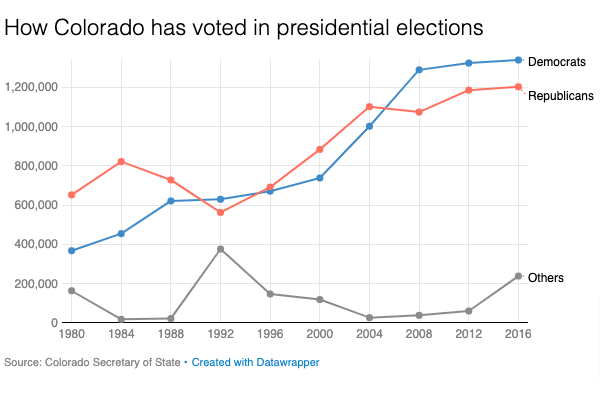
Colorado was once a reliable Republican win in presidential elections. In the 18 elections that took place between 1920 and 1988, Democrats won the state only four times. In the seven elections since, Democrats have won four times, including the last three. Link on denverpost.com
How each Colorado school performed on CMAS tests
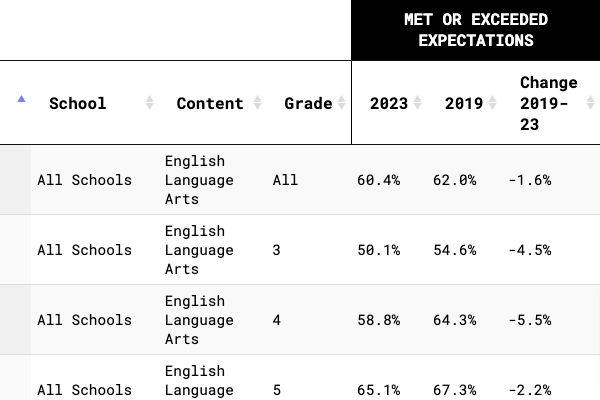
Colorado students’ performance in math and literacy is starting to rebound to levels not seen since before the coronavirus pandemic shuttered schools three years ago, according to new data released by the state Department of Education Thursday. The CMAS scores database allows readers to filter and sort test scores by district, school, discipline and grade. Link on denverpost.com
Colorado school lockdown and lockout database
The Denver Post collected data for more than 2,000 school lockdown and lockout incidents from 25 school districts across Colorado. The data was published in a series of maps, charts and a searchable table. Link on denverpost.com
The Big Payout: A visual look at where Colorado’s nearly $66 billion in federal pandemic aid went
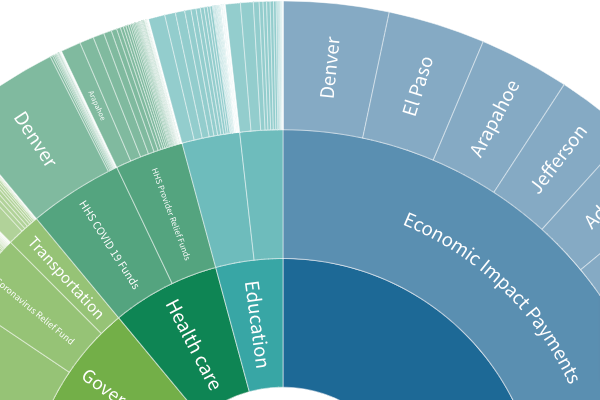
This page collects some of the graphics that ran with the series The Big Payout, which examined how the $63 billion in federal COVID-19 funding Colorado received was allocated. Link on denverpost.com, link, link, link, link, link, link
Map: Colorado has more than 400 “high hazard” dams, and 27 of them are deficient
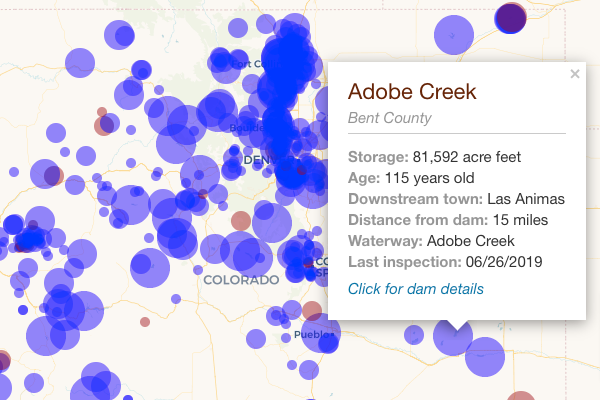
There are more than 1,700 regulated dams in Colorado, many of them privately owned. More than 400 of those dams are classified as "high hazard" because they are located near populated areas, and 27 of those are operating with restrictions in place. Link on denverpost.com
See where 1920s Denver Ku Klux Klan members lived, search the database
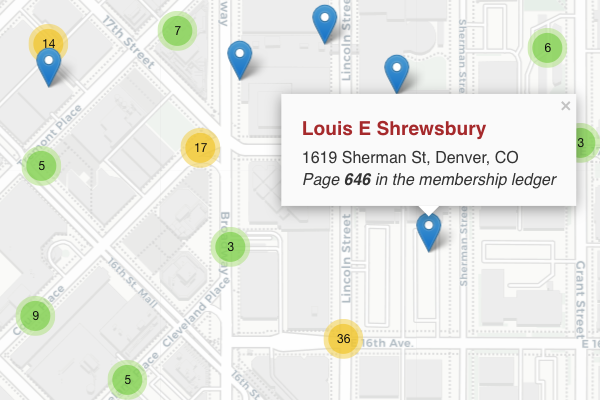
The map and database allow users to search membership of the Denver Ku Klux Klan chapter from 1924 to 1926. The ledgers were digitized by History Colorado staff, who spent more than 300 hours logging by hand each address. The ledgers contain approximately 30,000 entries. Link on denverpost.com
Since 1993, Colorado Rockies have worst record against National League West rivals
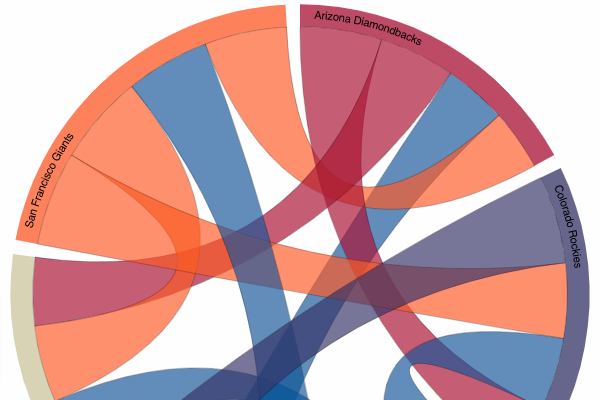
In the 24 seasons since the Colorado Rockies joined the league in 1993, the team has posted a winning record seven times. Against National League West opponents from 1993-2016, the Rockies have a winning record against only the San Diego Padres, and the worst cumulative record against division opponents. Link on denverpost.com
2023 NFL draft tracker: Picks, instant reaction and more live coverage
The NFL draft tracker shows teams and players they draft in real time. Reporters and producers enter player details into a Google Sheet that updates the app dynamically. Readers can sort and search the data using different criteria. Link on denverpost.com
Marshall fire: Map of destroyed or damaged homes and businesses
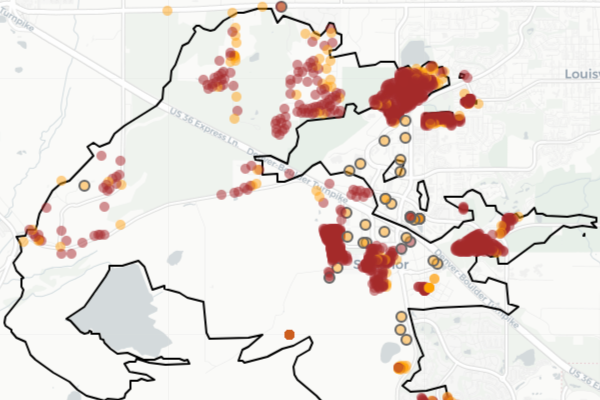
The map shows the locations of structures destroyed in the Marshall fire and allows users to zoom and pan, and includes popups with details. Link on denverpost.com, link
Find Colorado home values by ZIP code
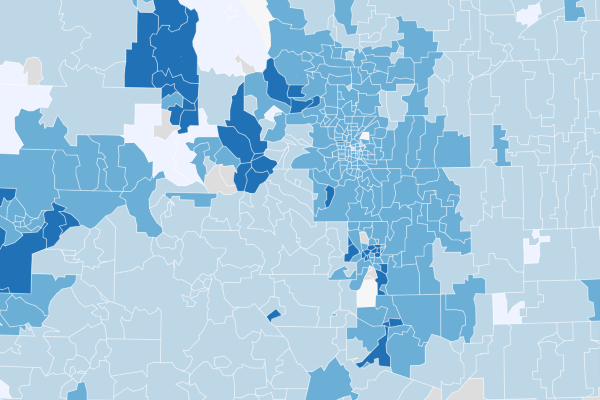
Home price gains the past 12 months through July are strongest in areas outside metro Denver, in particular the mountain resorts, the southern Front Range and Mesa County on the Western Slope. Colorado is one of eight states where more than half of ZIP codes have registered double-digit price gains the past year. Link on denverpost.com
Can you afford to buy a house? Try this income and home price calculator.
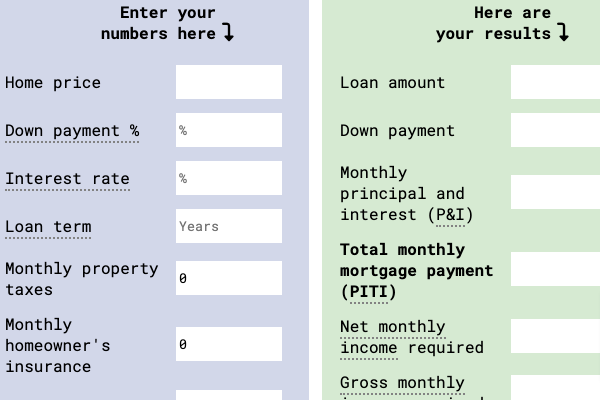
The home price calculator lets readers input their data and tells them how much house they can afford given a certain income or how much income they need to afford a certain home price. Link on denverpost.com